Optimizing algorithms can be demanding work, requiring a fine-grained understanding of what the processor is doing, involving many repeated measurement and adjustment iterations, depending on a theoretical understanding of computer science principles and mathematics, requiring specialized tooling and the knowledge of how to use it.
This article is about something completely different. We will take an example web app and – without ever touching the algorithm or tinkering with the internals of the data set – will restructure the way the application is put together to yield significant gains in performance.
The goal here is to show that we do not always have to dig deep into the bits and branches to improve performance. We may instead be able to achieve significant gains by adjusting how the “boxes and arrows” level design is put together. An application is a combination of components and how they work together matters.
Let’s dive in and take a journey through applying several optimization iterations to a sample app, leading us to significant throughput gains in the end.
Note: the code snippets in this article are extracts that showcase only the essentials. The complete repository together with benchmark scripts is available at https://github.com/sandersaares/forbidden-text-check.
Example scenario
Our example app is a typical Axum + Tokio stack Rust web service with a particularly data-heavy workload: it receives a POST request and attempts to determine whether the request body matches a large in-memory data set.
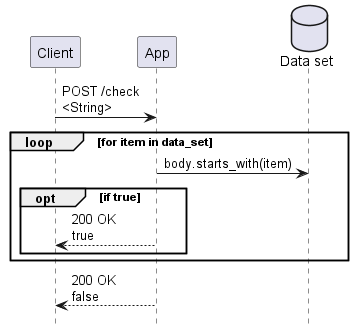
The algorithm is very simple: check if the request body starts with any of the strings in our data set. In our benchmark scenario this comparison will never match, so every request will search the entire data set, giving us consistent behavior under benchmarking.
The data set is just a Vec<String> stored in a static variable, with each entry being a string of length 640 and the total data set size being around 2.5 GB.
The example logic is completely pointless in terms of implementing something useful; it is merely a stand-in for “some algorithm that does a lot of looking up things in memory”. You could come up with a much better algorithm for the simple job it does but this article is not about algorithm optimization – we can assume that in a real world scenario the algorithm would already be “properly optimized” and all these comparisons and memory accesses are necessary for it to do its job.
As with any performance optimization, the results will vary for different workloads. The approach showcased in this article is targeting “tall” web services that have large in-memory data sets and host their instances on many-processor servers (100+ processors), though some of the individual techniques showcased may also have value in services that rely on many small instances and scale horizontally.
Measuring performance
Benchmark design is a vast topic of its own, so we will merely describe the essential facts in this article. The target will be benchmarked using the excellent k6 benchmarking tool, using a benchmark script that merely POSTs a constant string to the service:
Each benchmark run will last for 250 seconds, which should be enough to ensure reproducible and stable results. We will observe the average throughput over this period, as well as the P95 request latency. Before each benchmark run, we will execute the same script for 10-30 seconds and throw away the result, to warm up the target service and initialize the in-memory data sets.
Our algorithm is pure compute with no I/O, so we will use three k6 load generators per processor (CPU core) in the target system. Assuming one worker thread per processor, this means there will generally be one request being processed by each worker, with up to two additional requests waiting in the queue.
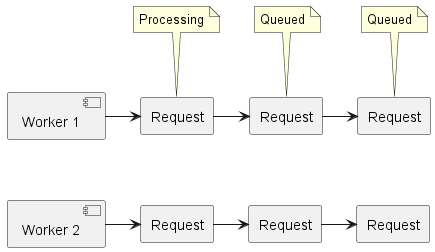
Keeping requests queued up ensures that we never leave a worker without work to do while also allowing us to measure whether all workers are processing requests at a consistent rate. The P95 request latency metric will tell us how well balanced our queues are – large P95 latencies will indicate that some queues are slowing down and not keeping up as well as others.
For reference, the command used to start a benchmark run is:
k6 --vus <3 * target_processors> --duration 250s script_name.js
The author’s test environment has 176 processors, so the --vus parameter was set to 528. Adjust to match your target system’s processor count when you run the benchmark.
Starting point
We create a minimal Axum based web service as our first implementation:
Benchmarking the initial version on Windows Server 2022 gives us the following result:
| Req/s | P95 ms | |
| Initial version | 544 | 2450 |
The exact number here does not really matter – we want to increase throughput and decrease latency no matter what the numbers are. Let’s get to it.
From multithreading to many-threading
A typical Rust web app is hosted on a Tokio async task runtime that manages one worker thread for each processor in the system. On top of these is a web application framework like Axum, which manages a router, holds shared application state and uses Tokio to dispatch request processing work to request handlers created by the service author.
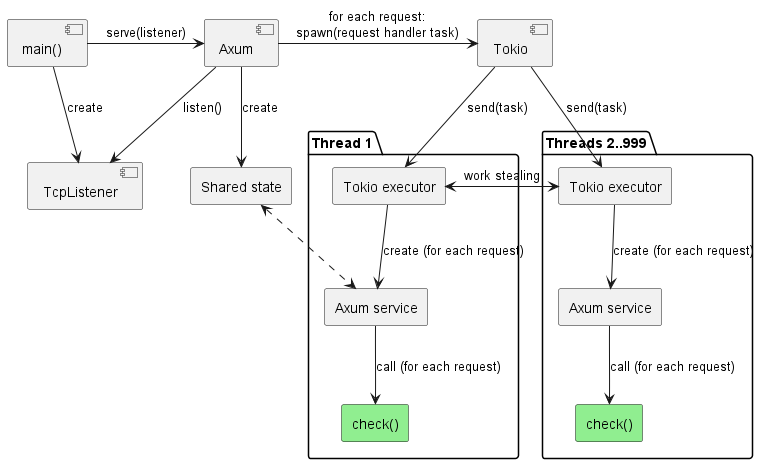
One Tokio. One Axum app, typically hosting some shared state. 100+ processors. There are two problems with this picture:
- The different components of Tokio on different threads must collaborate and coordinate their work. Unfortunately, logic that scales well to 10 processors is very different from logic that scales well to 100+ processors, so this coordination overhead becomes noticeable at scale.
- Even though Axum itself does not internally rely on multithreaded collaboration to a significant degree, the standard app construction patterns encouraged by Axum often lead to heavy use of shared global state by services and middleware components. Sometimes the shared state is justified but often there are alternative approaches available.
Both factors can introduce significant overhead, which we want to eliminate. We will ignore the second factor in this article because the logic in our example app is so trivial that it is already thread-isolated and does not rely on shared state. Refactoring the service logic itself to make use of thread-isolated design with no shared state is a topic of massive depth and breadth with potentially huge payoff; it may one day get its own series of articles – leave a comment if you have specific scenarios in mind that you would like to see covered.
What we can easily do, however, is get rid of the Tokio multithreading overhead by restructuring the service to consist of independent threads of execution. While the request handler logic in our example app (the green box) is already completely thread-isolated, the components leading up to it are not. There are two paths toward a thread-isolated future here.
If we were to be ambitious, there exist web frameworks like ntex that are designed specifically with thread-isolation in mind, and which achieve great results by making thread isolation a core element of their function and design from top to bottom. However, because of their highly optimized design such special-purpose frameworks are generally incompatible with the rest of the Rust ecosystem – you cannot use many existing crates in your app when using a web framework that enforces thread isolation.
We will take a more conservative and broadly applicable path in this article by sticking to Tokio and Axum but restructuring how they are put together, to yield some of the performance gains while still maintaining ecosystem compatibility. The key is to disable the multithreading capabilities in the framework components while still retaining the core web service functionality.
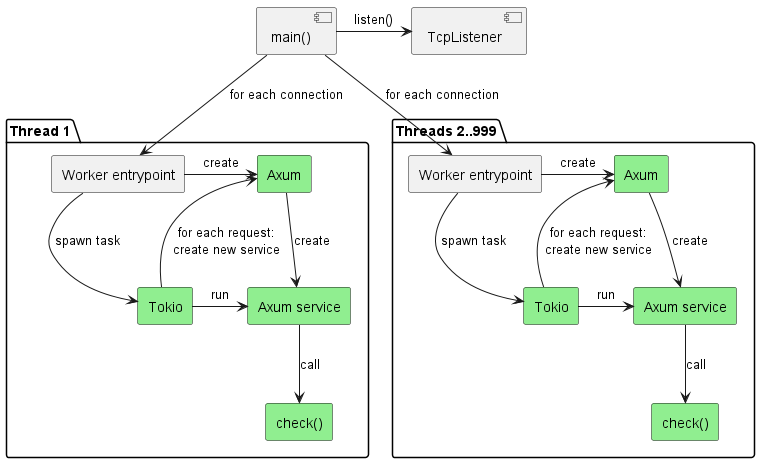
First, we create our own thread pool instead of allowing Tokio to manage the threads. Then we create a single-threaded Tokio runtime on each of these worker threads and give it control over the thread.
We leave the main() entrypoint thread to process incoming connections and hand them off to workers. Meanwhile, in each worker we create an entirely independent Axum app on thread startup, which we use to serve incoming requests from connections assigned to that worker, by creating a request-specific Axum service for every request (same as Axum does internally in its default configuration).
Each thread now uses its own isolated instance of Tokio and Axum. By doing so we have eliminated a substantial part of the multithreading coordination overhead from the frameworks. Just a part, not all – to truly eliminate it all would require deep changes such as completely removing the use of shared primitives like Arc and Mutex, which is impractical without rewriting the frameworks (and is how competing frameworks like ntex achieve their high efficiency).
All the parts marked green on the diagram are now thread-isolated – even if they use synchronization primitives internally, there is never contention with other threads, which is already a big win. If cross-thread coordination is explicitly required, this can be accomplished by setting it up via collaboration of main() and the worker entry points. In our example service, there is no need for this.
Full code of restructured app: forbidden-text-check/examples/03_per_processor.rs at main · sandersaares/forbidden-text-check · GitHub
What do we gain for all our effort?
| Req/s | P95 ms | |
| Initial version | 544 | 2450 |
| Thread-isolated | 614 (+13%) | 1000 (-59%) |
We gained a fair bit of throughput and lost a lot of latency, indicating that requests now get processed more consistently and spend less time queued. Both throughput and latency can be performance-critical so this is a great start.
It is important to note that these numbers are extremely workload- and environment-dependent. Our example service is a pure compute workload, which means we never spawn or await other tasks – every request is one task and that is it. Therefore, the number of active tasks is very low, which simplifies work for Tokio and reduces its overheads. Different kinds of services with heavy task-management workloads and a larger number of smaller tasks (e.g. HTTP client tasks for talking to external services) may experience even higher Tokio multithreading overheads and see greater gains from a move toward thread isolation.
The benchmarking so far has been performed on Windows Server 2022. There is quite a lot of platform-specific logic in the depth of the Tokio I/O stack, so it is worth also running the benchmarks against a Linux target. Let’s try Ubuntu 24 on the same hardware.
| Req/s (Win) | P95 ms (Win) | Req/s (Linux) | P95 ms (Linux) | |
| Initial version | 544 | 2450 | 1842 | 637 |
| Thread-isolated | 614 (+13%) | 1000 (-59%) | 1839 (-0%) | 305 (-52%) |
The relative gain in throughput disappears on Linux. The likely reason for this is that our example service performs minimal task management and most of the work that Tokio performs is related to I/O functionality. Tokio is known to have a fairly inefficient I/O stack on Windows, which explains why the throughput gains for our simple example app are only visible on Windows. Other workloads may also see gains on Linux here. The latency improvement remains present on both platforms, which is a good sign that we are heading in the right direction.
Hey, that is a different number of digits!
Yes, you may have noticed that the absolute numbers for Windows do not compare favorably to Linux. Yet the exact same hardware is used! This is something we need to look into deeper before we go further with our optimizations.
Our initial version was very simple and based on trivial “how to make an Axum web app” samples easily found online. There can be no fundamental service design flaw here. How could it possibly underperform so much? Our workload is almost entirely pure string comparison code – such simple logic cannot just be magically 3x slower on Windows!
There are different techniques one might use here to investigate the problem. For example, applying profilers such as VTune, trying different compiler options, checking for presence of Windows antivirus and/or enterprise monitoring tools that may slow things down, and more.
However, we will start with a much simpler technique: let’s open Task Manager while the benchmark script is running.

Oh. On Windows, the service is only using 25% of our processors, leaving the others idle! A quick check shows 100% utilization on Linux, so this must be the problem.
For some background knowledge, understand that the support for many-processor machines in the Windows API has gone through at least three generations over the past 25 years:
- At first, there was just a 64-bit field for processor affinity and that’s all you had to work with. Have more than 64 processors on your system? Tough luck – each process could only access 64 at most. At least it could be a different set of up to 64 for each – Windows internally divided processors into processor groups, one of which was assigned to each process.
- A couple decades ago, Windows APIs started to support having the caller specify the processor group as well as allowing a single process to span multiple processor groups (to various degrees in different Windows versions). There was a separate 64-bit affinity mask for each processor group, so if there were more than 64 processors, a sufficiently smart app could also specify the group number when talking to Windows, though you could still only specify a single processor group when configuring affinity.
- The modern Windows API is based on “CPU sets” which are a fully flexible mechanism. Among other things, every process or thread can now be bound to any set of processors, giving complete freedom of choice to apps that know to use this API.
The root cause of our under-utilization problem is that Tokio uses the num_cpus crate to identify how many processors are present on the system and this crate uses the 1st generation of Windows APIs. This means it can only ever see a single processor group of up to 64 processors.
Our target system has 176 processors split into 4 groups of 44, so accordingly, Tokio (via num_cpus) believes that there are only 44 processors on this system and only starts 44 worker threads!
let num_workers = num_cpus::get();
When we implemented our own worker pool creation logic, we copied the Tokio logic of using num_cpus to identify the correct processor count. Let’s switch to the many_cpus crate, which can give us the correct number of processors.
| let processors = ProcessorSet::default(); | |
| let num_workers = processors.len(); | |
| let mut work_txs = Vec::with_capacity(num_workers); | |
| for _ in 0..num_workers { | |
| const WORKER_QUEUE_SIZE: usize = 4; | |
| let (tx, rx) = channel(WORKER_QUEUE_SIZE); | |
| work_txs.push(tx); | |
| // In each loop iteration, we spawn a new worker thread that the OS is allowed to assign | |
| // to any of the processors in the set to balance load among them. This is almost entirely | |
| // equivalent to `thread::spawn()`, except by using `ProcessorSet::default()` we ensure that | |
| // all processors are made available for these threads on Windows, even on many-processor | |
| // systems with multiple processor groups where threads can otherwise be limited to only | |
| // one processor group. | |
| processors.spawn_thread(move |
|
| } |
A quick look at Task Manager again – did anything change?

Yes, now we are getting our money’s worth! The results look much better:
| Req/s (Win) | P95 ms (Win) | Req/s (Linux) | P95 ms (Linux) | |
| Initial version | 544 | 2450 | 1842 | 637 |
| Thread-isolated | 614 (+13%) | 1000 (-59%) | 1839 (-0%) | 305 (-52%) |
| many_cpus | 1192 (+119%) | 792 (-68%) | 1864 (+1%) | 313 (-51%) |
That’s more like it!
Or, well, is it really?
Leaving aside the still-present difference between Windows and Linux, why did throughput not rise 4x when we used 4x as many processors? Only doubling the throughput after essentially spending 4x the money on processors is not a good return on investment.
On the surface of it, this smells like a typical previous-generation “only scales up to 20 processors” algorithm is at fault but how could it be? After all, this is the code where we already enforced a high degree of thread isolation, so there should not be any synchronized work going on between the worker threads to slow them down!
A quick check for comparison on Linux, limiting the app to only 25% of processors, indicates the same problem there – the throughput does not scale linearly with the number of processors, even though it should! Time to put our thinking hat on.
Where is the data set?
Let’s consider what might be behind the mediocre scaling relative to hardware resources. One aspect that characterizes our sample scenario is that the app works with a fairly large in-memory data set – that multi-gigabyte Vec<String> we are searching through for every request. Where is it, though?
Yes, okay – it is in that static variable. Fair enough. We can also say that this static variable is just a reference to an array of String, each of which is a reference to an array of bytes, and that each of these arrays is an allocation somewhere on the heap.
While memory allocators are a fascinating topic, they are not relevant to our scenario because our data set is static – even if we cared about memory allocation performance, there is no significant allocation activity happening during our benchmark runs (relatively speaking – one could always do better but this is not where the bone is buried).
On a more fundamental level, where is this data? It is in one (or more) of these:

The data is in physical memory modules. A piece of silicon, copper and plastic. Some of the data may also be in processor caches but the majority is in main memory because the data set is simply too large to fit in processor caches.
This memory module is physically connected to a group of processors. Depending on the hardware architecture, this group is either an entire processor package (the thing that plugs into a processor socket) or a core complex (CCX, a subdivision of a processor package). The target system we are using here has four CCXs, each connected to 25% of main memory. Another way to state this is that there are four memory regions.
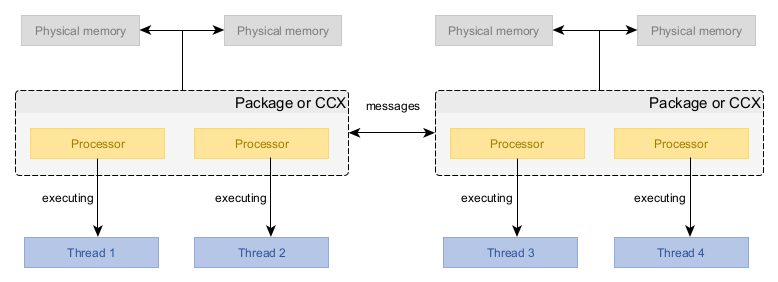
A processor only has direct access to main memory connected to its package/CCX (i.e. within the same memory region). If it wants to read from or write to memory modules that are not directly connected to it, it must do this by passing this request to some other processor that is directly connected. This message-passing is relatively expensive and requires synchronization between processors. It is both slower (yielding higher access latency) and offers less total throughput, compared to accessing directly connected memory.
Typical cost differences when accessing main memory within and across memory regions (ballpark figures, reality is completely hardware-dependent):
| In-region | Cross-region | |
| Latency | 100 ns | 200 ns |
| Throughput | 200 GBps | 100 GBps |
So, where is our Vec<String> within these physical memory modules? It does not matter! Whatever the answer may be, our data set cannot be directly accessible by all the processors at the same time.
This is why we did not see a 4x increase in throughput – regardless of where the data is, 75% of the memory accesses must cross a memory region boundary and therefore suffer reduced performance. Only the processors that are in the same memory region as the data can process requests at full speed.
The solution is simple: we can copy the data into every memory region and put that expensive hardware to good use – unused memory is wasted memory!
That is easier said than done, though. There is no memory_region parameter in Clone::clone(&self) – how are we meant to do this, exactly?
We will rely on a 3rd party crate here and use the region_cached! macro from the region_cached crate. This macro enhances a static variable with region-locality powers – when writing, it acts as a global variable but when reading, the data always comes from the same memory region.
There is also an equivalent region_local! macro in the region_local crate for cases where you do not want updates to be distributed to all memory regions – it is functionally very similar to the thread_local! macro.
The results are mixed, though:
| Req/s (Win) | P95 ms (Win) | Req/s (Linux) | P95 ms (Linux) | |
| Initial version | 544 | 2450 | 1842 | 637 |
| Thread-isolated | 614 (+13%) | 1000 (-59%) | 1839 (-0%) | 305 (-52%) |
| many_cpus | 1192 (+119%) | 792 (-68%) | 1864 (+1%) | 313 (-51%) |
| region_cached | 784 (+44%) | 1680 (-31%) | 2700 (+47%) | 213 (-67%) |
Linux sees an immediate improvement in both metrics but Windows suffers a regression. Our change was supposed to make things better but something clearly went wrong there.
The Windows memory manager can be picky
To understand what is happening, we will first verify some assumptions. Namely, is the region_cached! macro really distributing our data to different memory regions?
On Linux, you can verify this as follows:
$ numactl --hardware | grep "free"

node 0 free: 191083 MB
node 1 free: 191971 MB
node 2 free: 191909 MB
node 3 free: 191850 MB
Comparing these numbers before and during a benchmark run shows us that the Linux app is correctly copying the data into all the memory regions – available memory goes down on all rows.
On Windows, the most foolproof approach is to open Performance Monitor and add counters from the “NUMA Node Memory” object onto the graph (a NUMA node is the same as a memory region). You may need to fiddle with the scale of the graph to get it to show up in a useful way.
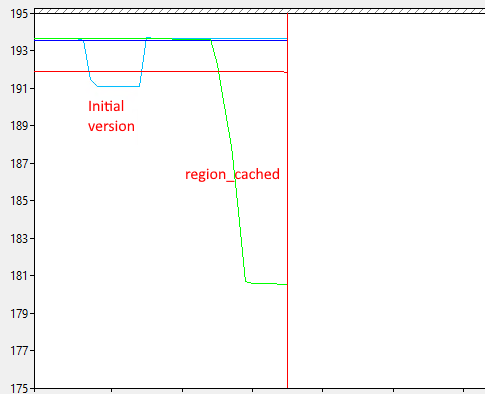
Each of those lines is the available memory in a memory region. We expect the lines to go down for all four memory regions. However, graph shows that the Windows app is instead copying its data multiple times into the same memory region! That explains why Windows performance dropped – it is now scanning through 4x as much memory, reducing processor cache efficiency.
The operating system is responsible for assigning physical memory pages to allocated virtual memory. There are two ways to guide its decisions on which physical memory modules are used:
- A sufficiently smart memory allocator can use memory-region-aware operating system APIs to allocate memory in a specific memory region. Our app does not do this and neither does the
region_cachedcrate because this requires a custom memory allocator, which is not practical as a general purpose approach in Rust – we need everything to work right even with the default Rust memory allocator. - The operating system has some built-in logic to make the decision based on various signals from the process and operating environment. One of the signals it uses is “which memory region is the thread currently running in”.
We rely on the default behavior of the operating system, so there are two things that may be going wrong here:
- The data set for all regions may be getting initialized from threads running in a single memory region.
- There are some hidden extra variables at play which guide Windows memory manager decisions.
The first option can be quickly eliminated – the region_cached crate specifically checks what memory region we are running in and only ever initializes the current memory region to minimize the probability of any cross-region allocation. A second data point against “we are in the wrong region” being the cause is that the same logic works fine on Linux.
This leaves us with there being extra variables at play. To cut a long story short, experimental evidence suggests that Windows requires a thread to be pinned to a specific processor in a specific memory region before it allocates physical memory in that memory region.
Recall that while our example service does create its own threads, it assigns every thread to run on ProcessorSet::default(), which means the operating system is given complete freedom to choose which processor is used for which thread (and it may even change its mind at any point and reshuffle the threads). For whatever reason, this does not give the Windows memory manager the confidence that current-region allocation of physical pages is the right thing to do.
We need to change our worker thread setup so that each thread is pinned to a specific processor. This is quite simple to do because it is built-in functionality of the many_cpus crate: instead of looping through the processor count, we use ProcessorSet::spawn_threads() to create a separate thread pinned to each processor.
| let processors = ProcessorSet::default(); | |
| let num_workers = processors.len(); | |
| const WORKER_QUEUE_SIZE: usize = 4; | |
| let (txs, rxs) = (0..num_workers) | |
| .map(|_| channel(WORKER_QUEUE_SIZE)) | |
| .unzip::<_, _, Vec<_>, Vec<_>>(); | |
| // Each worker thread will pop one Receiver out of this vector, so it needs to be shared. | |
| let rxs = Arc::new(Mutex::new(rxs)); | |
| // This method will create one thread per processor and execute the callback on each of them. | |
| // Every thread will be pinned to a specific processor, so the OS will not move them around. | |
| processors.spawn_threads(move |
|
| let rx = { | |
| let mut rxs = rxs.lock().unwrap(); | |
| rxs.pop().unwrap() | |
| }; | |
| worker_entrypoint(rx); | |
| }); |
Pinning threads to specific processors is a valuable optimization technique even outside many-processor systems. Experiment and leave a comment with your specific scenario if you find that it helps you.
Does the data now show proper use of all memory regions?
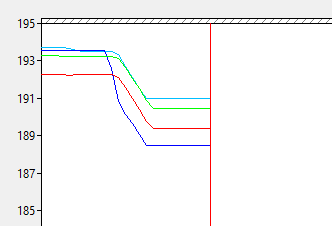
Indeed it does, and the benchmark results confirm great success:
| Req/s (Win) | P95 ms (Win) | Req/s (Linux) | P95 ms (Linux) | |
| Initial version | 544 (-54%) | 2450 (+209%) | 1842 | 637 |
| Thread-isolated | 614 (-48%) | 1000 (+26%) | 1839 (-0%) | 305 (-52%) |
| many_cpus | 1192 | 792 | 1864 (+1%) | 313 (-51%) |
| region_cached | 784 (-34%) | 1680 (+112%) | 2700 (+47%) | 213 (-67%) |
| Pinned threads | 2251 (+89%) | 245 (-69%) | 2717 (+48%) | 213 (-67%) |
The Windows relative percentage scoring was adjusted to use many_cpus as the baseline here, given that counting the increase from simply using more processors would show unfair improvement compared to Linux (+319%).
The final code is available here: forbidden-text-check/examples/06_region_cached_pinned.rs at main · sandersaares/forbidden-text-check · GitHub
It is true that the Windows results are still lagging behind Linux but that is a story for another day.
Applicability
Aside from fixing the Windows processor count oddity, this article covered three structural optimization techniques:
- Ensuring data locality in the same memory region.
- Thread isolation.
- Pinning threads to specific processors.
In this article, the major payoff for Linux came from ensuring data locality, while the rest mainly just benefitted Windows.
Nevertheless, all these techniques are valid in their own right, depending on the type of workload you are working with:
- When there is a high degree of task management and I/O, thread-isolated design shows off its strengths by eliminating many synchronization overheads from the frameworks.
- The greatest impact from thread-isolated design comes from ensuring that service logic itself is thread-isolated, though this can be difficult as it requires specific design patterns to be ergonomic. In our example scenario, we already started off with thread-isolated service logic, so this application of the technique was not showcased in this article.
- Pinning threads to specific processors is not only relevant for data locality on Windows but can also help avoid cache thrashing when many workloads compete over the same processors.
- Combining high I/O workloads and thread pinning can yield great results because I/O activity for a single file/socket is contained to a single thread, avoiding cache trashing that occurs if async I/O is completed on random processors in a multihreaded I/O driver.
The difficulty with many structural changes is that there is no single “bottleneck” – the impact is smeared across the app like peanut butter, gaining 0.5% here and 0.5% there. You can rarely tell from a profiler that you would benefit from such techniques – you just have to try them out to find out.
But not always so. The workload in our example scenario was deliberately chosen to be “obviously optimizable” in a measurable way. If we wanted to see some evidence “in advance”, what we could have done is the following:
- We extract the core logic (the “process request”) into a separate binary where we run it in a loop enough times to run for 15+ seconds.
- On a physical Intel system, we execute this binary under the VTune profiler and apply its Microarchitecture Exploration analysis.
- We examine the report summary. The parts highlighted in red are typically the key.
In our sample service, the core logic can be found in stand-alone from in examples/check_static.rs. Executing this under the VTune profiler gives us the following result:

Without even going into the details on the left, the big drawing on the right immediately tells us what we need to know. We observe that when executing the core logic of our service:
- 70.0% of the time the processor is doing nothing at all because it is waiting for data to be loaded from memory.
- 12.9% of the time the processor did some useful work.
- 14.7% of the time the processor could not do some useful work due to some internal microarchitectural bottleneck (i.e. the code was of a kind that it could not process with full speed).
The 70% is our clue here – if an application is spending 70% of its time waiting for data to arrive from memory, it is going to see a huge performance impact from how fast that memory access is. This is why we saw a large performance increase when we switched to region-local caching of our data set.
References
GitHub – sandersaares/forbidden-text-check: Rust web service performance exploration
Optimizing applications for NUMA, Intel
Fix Performance Bottlenecks with Intel® VTune™ Profiler
Microarchitecture Exploration Analysis for Hardware Issues
Load testing for engineering teams | Grafana k6

Fantastic analysis! Have you given any thought to doing a similar analysis with a thread per core model using io-uring/IoRing?
LikeLike
Indeed, taking greater advantage of thread-isolated execution combined with high performance I/O APIs is a fascinating topic and there are significant gains to be made compared to the Rust status quo, especially on Windows where Tokio I/O efficiency is rather poor.
I try to target my public writing toward generally applicable multiplatform approaches, which complicates things somewhat given that some of the more known existing implementations like monoio are Linux-only. That said, some more portable competition has appeared in recent years (e.g. Compio). Still, there are problems applying high performance I/O in practice – for example, the Hyper HTTP stack is very much designed for poll-based I/O APIs. Unfortunately the modern I/O APIs are not poll based, so there are some conceptual incompatibilities that need to be solved there to support high performance I/O without eating away most of the gains higher in the stack due to copying that results from this architectural mismatch.
Essentially, I would much rather write about solutions than problems, so sharing more on this first requires more of these problems to be solved. The topic is definitely on my radar and I have some hope that the Rust ecosystem will evolve toward making these techniques more approachable in the future.
LikeLike