A previous article illustrated how algorithms written in naïve C# can easily underperform due to being sloppy with memory allocations. It is a common assumption for engineers moving from the .NET world to the Rust world that this problem is automatically solved by Rust because “Rust is more efficient”. Alas, this is not the case.
Even in Rust, being careful with memory allocation remains of critical importance if we intend to write efficient code. This article is a practical guide on how to track down and eliminate typical cases of memory allocation in Rust code, showcasing analysis techniques and easy solutions to a selected set of common inefficiencies while using freely available tooling for the investigation.
We will take a sample application, analyze its memory allocation behavior, and iteratively optimize it until we judge it sufficiently improved. This walkthrough is intended to share a technique that we can apply on any Rust code – the specific fixes applied, while fully described and generalizable, are of somewhat secondary importance compared to the analysis method itself.
The code snippets below are only a partial view to conserve screen real estate and your attention. The full code is available in GitHub.
Example scenario
To minimize “app framework” boilerplate and focus on demonstrating the technique, we will implement a fairly synthetic JSON processing problem as a command line application. We might say that this resembles a trivial Advent of Code puzzle.
We are holding a poetry contest! Many authors have submitted entries for different rounds of the contest. The organizers have a set of categories that points are awarded for, with specific criteria used to map entries to categories, as well as rules for scoring and disqualification of entries.

We want to calculate the total number of points awarded to all authors over all the rounds. The evaluation rules are:
- An author gets 1 point in a round per category if they are one of the winners of that category.
- The winner of each category is the author who made the highest-weighted poem that qualified for that category (with all winners being awarded a point in case of a tie).
- The weight of an entry is its content length in bytes divided by word count.
- Entries with zero words and entries above 1000 bytes in length are disqualified.
- An entry qualifies for a category if its title contains any of the keywords of the category.
- Each round of the contest is scored independently.
These rules are all fairly arbitrary and exist only to force us to write logic with a specific shape in our solution, allowing us to demonstrate both memory-inefficient and memory-efficient ways to write Rust code.
A sample data set generator is available in GitHub under examples/generate_data.rs, also defining the file format, consisting of a manifest.json entry point file with the entries of each round in separate round_123.json files.
The starting point: a decent but simple solution
We start with a straightforward solution that reads the input JSON documents using serde_json and deserializes them into a Rust object model:
This implementation first loads the manifest and then processes each round one by one, simply executing the rules of the scenario to accumulate the scores for each author and yield the answer to the problem. The core logic of the solution is represented by the following function signatures:
You can see the full code in GitHub: v01_simple.rs. We will not go through all 150 lines here in detail. Instead, this article will focus on specific snippets of relevance when it comes to analyzing performance and applying optimizations.
The code in our initial implementation is simple but not foolish – there are obvious ways we could make it less efficient (e.g. loading all the rounds into memory at the start, failing to use lookup maps for category assignment, …) but we try to avoid the worst sins here. This is not meant to be intentionally bad code, just code that could be better.
Before we can talk about optimizations, we need a way to evaluate the performance in a way that allows us to compare before/after and different implementation choices. How good or bad is the code? If we make a change, how do we know if we made it better?
To evaluate, we must measure
The most common way to evaluate performance of Rust code is via Criterion benchmarks. Let’s create a simple benchmark to measure the performance of our simple solution:
There is a small problem with this approach, though: Criterion evaluates the duration of code execution in wall clock time. It does not measure memory allocation behavior.
v01_simple time: [1.7269 s 1.7382 s 1.7494 s]This is still better than nothing – the whole point of optimizing memory allocation behavior is to make the program faster, so if we succeed, we should still see an improvement in the numbers.
However, better than nothing is not good enough. Having only indirect metrics like wall clock time can make it more difficult to relate cause and effect and to validate whether our code changes really are doing what we think they are doing. We need more information if we want to avoid stumbling in the dark.
While there exist alternative benchmark frameworks with capabilities not offered by Criterion, we will stick with the mainline Criterion here and simply extend it with alloc_tracker which enables us to obtain data about memory allocation in Criterion benchmarks.
When we run our benchmark, we now get additional insights into the memory allocation behavior of our solution:
memory/v01_simple       time:   [1.7808 s 1.7962 s 1.8128 s]

Allocation statistics:

| Operation             | Mean bytes | Mean count |
|-----------------------|------------|------------|
| v01_simple            | 2154088990 |   10697388 |
We now see the count of allocated bytes (2 GB!) and the count of allocated objects (10 million!). All the numbers reported here are per benchmark iteration.
Well, now what? How do we make the numbers smaller? This information is still not enough to guide optimization work – all it does is give us a better sense of the scale of the problem and of the specific difference any hypothetical changes will make.
It is true that in the most basic cases, it can be enough to rely on rules of thumb to optimize memory usage (e.g. clone() often allocates memory, Box::new() always allocates memory, ::with_capacity() allocates less memory in aggregate than starting with ::new(), …). However, rules of thumb will only help us in the simplest of cases so are not a general-purpose solution. They are the special case, not something we can rely on if we want to be thorough.
The general solution is to start tracking down the specific method calls that allocate memory.
To understand, we need detailed data
There are no good Rust memory profilers known to the author – memory-specific analysis tools that do exist (e.g. Massif) tend to be very cumbersome and annoying to use. Do not bother with them – specialized memory allocation analysis tools are not worth your time.
Instead, we can take advantage of the core tenet behind this article – allocating memory is something that greatly slows down programs. Another way to say that is that inefficiently written programs spend a lot of their time on allocating memory.
While memory analysis tools are mostly unusable, there are many good profilers that tell us what our programs are spending time on! This is the key technique – we do not actually need to look for memory allocation activity; instead we look for where our program is spending its time. By identifying the time spent on allocating memory, we can backtrack to identify where the memory allocations are coming from!
An excellent free tool for this is VTune. While the tool is authored by Intel, its basic feature set also works on processors from other manufacturers. All the VTune features referenced in this article are available on any modern processor and operating system.
Before we can apply VTune to our code, we need to adjust our Cargo configuration to provide better data for the profiler in release builds. We add the following to the workspace-level Cargo.toml:
While we could directly apply VTune to our Criterion benchmarks, this is not the right approach. The problem there is that Criterion does not run a fixed workload – each time we run the benchmarks, Criterion may execute a different amount of work. Any results we get from Criterion benchmarks under VTune would not be comparable from run to run! Profiling Criterion benchmarks only makes sense in the exploratory phase of an optimization quest, not as part of a systematic workflow.
Instead, we create a separate example executable that calls our logic a number of times in a loop (enough to generate at least 30 seconds of data). This way we measure the same workload every time we profile our code.
Now let’s apply VTune to this code. First, we execute cargo build --release --examples to generate the release-mode binaries. On Windows, the resulting binary will be found at a workspace-relative path like target\release\examples\profile_target.exe.
Having generated and located the release-mode binary, we can proceed with the VTune analysis:
- Create a new VTune project or reuse an existing one. Projects are just folders of results with no real extra meaning – it does not matter which one you use.
- Press the big blue “Configure analysis” button to start a new analysis run.
- Fill in the following fields, leaving others at their default values:
- WHERE = Local Host
- WHAT > Application = C:\path\to\profile_target.exe
- HOW = Hotspots
- Press the big blue ▶️ Start button at the bottom.
- Wait for the application to run and the analysis summary to be displayed.
We should now see the Summary tab with data resembling the following:

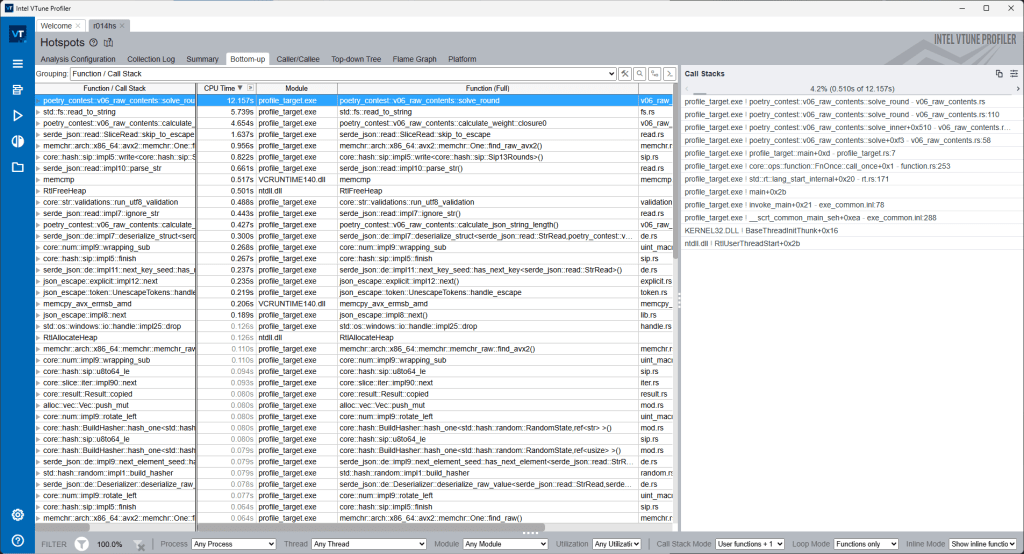
The data of interest to us is on the Bottom-up tab. This list contains the hotspots in our program – the lowest level functions that the program is spending a lot of time on.

On Windows, the following lines are of greatest interest to us:
RtlAllocateHeapRtlReAllocateHeapRtlFreeHeap
These are calls into the Windows heap APIs. The Windows heap is where our dynamically allocated memory comes from on Windows. On other operating systems, refer to the programming reference of the compiler’s standard library to understand what to look for instead.
When applying this workflow to a real-world program, you might encounter obfuscated data here if using a custom Rust memory allocator. During memory allocation optimization, any custom memory allocator should be disabled. The example code uses the default Rust allocator.
The process of optimizing memory allocation in an application largely boils down to reducing the time that VTune attributes to these lines in the table. When we make progress in optimizing, we expect to see the numbers go down for all these lines. For reference, with the initial simple solution, the memory allocation related lines consume around 20% of the processor time spent by the program.
Note that more memory-efficient programming techniques can also reduce the work required outside these specific functions, so the total achievable gain may be greater than 20% because additional benefits may appear through secondary effects like improved memory cache efficiency, reduced heap fragmentation, algorithmic improvements or lazy evaluation that are enabled by more memory-efficient logic, and more.
Enough about that – how do we find out what actually allocates the memory? The right side of the screen contains the answer. Select RtlAllocateHeap in the list and observe what shows up on the right:
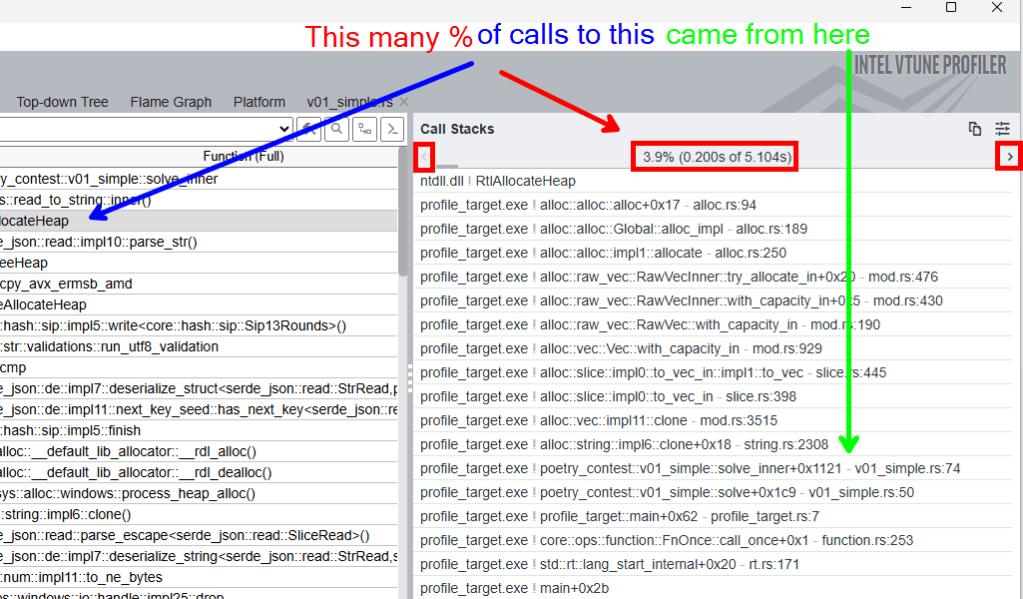
We see a stack trace! This is where the treasure is found – this stack trace tells us how our program came to be in this memory-allocation-related function. Work backwards in the stack trace to understand what happened. The transition between user code (our poetry contest solver) and library code is often the most informative part of the stack trace.
There are multiple stack traces associated with each line in the table because the same function may be reached via different paths through the program. The little left/right arrows (highlighted in red above) allow you to navigate between different stack traces. By default, it shows the most impactful one – the stack trace that contributed the largest % of processor time.
Sometimes multiple entries in this data set are more or less duplicating each other – this is perfectly normal and just an imperfection of the interactions between Rust, the compiler and VTune, each of which has a different view of the program. As a result of this, VTune sometimes has difficulty attributing the stack trace lines to the right lines in code. It is an imperfect data set – some manual investigation/correlation, trial-and-error and gut feeling can prove useful. Sometimes we just have to search our code for all the calls to foo() because the stack trace leaves it unclear how we got there.
Let’s start our optimization process by simply going through the top contributors listed in VTune for RtlAllocateHeap.
Optimization: reduce clones of the author name
When analyzing the stack traces, the most important part is the transition from user code (our poetry contest app) and library code, as this is the part under our control. In the first stack trace we encounter, the transition is the following:
profile_target.exe!alloc::string::impl6::clone+0x18 - string.rs:2308

profile_target.exe!poetry_contest::v01_simple::solve_inner+0x1121 - v01_simple.rs:74
This tells us that something in solve_inner() called String::clone(). VTune attributes this to line 74 in v01_simple.rs. You can click on the line number to navigate to the code in VTune.
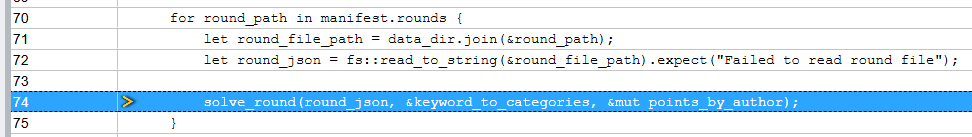
Unfortunately, we immediately see that there is no String::clone() on this line – this is just a call to solve_round(). VTune failed to correctly attribute this stack trace entry to the right line of code. This is perfectly normal, as compiler optimizations can destroy some of the relationships required for analysis. The string cloning is happening somewhere inside this call to solve_round() but we do not get more information from VTune because the data available to it was not precise enough to pinpoint the line.
A simple workaround is to search our code for relevant-seeming occurrences of clone(). This is not foolproof – there may be layers between those visible in our stack trace (optimized away before VTune saw them) – but in many cases this can lead us to the right location.
In our simple implementation, there is only one call to clone(), which is very likely to be the suspect we are looking for. When the program is attributing awarded points to an author, we always clone the name of the author:
The way this score attribution logic works has multiple layers:
- In top-level logic, we have a
HashMap<String, u64>that collects the accumulated score for each author, keyed by author name. - Within the round-specific logic, for each scoring category we collect a
Vec<String>with the names of authors who are to be awarded a point for that category. - The author name comes from
Entry.authorwhich is a field of typeString.
Can we do better here? Yes.
The Vec<String> with the round-specific data is only used while the round is being processed, which means all the entries in the round are guaranteed to live at least as long as this collection. We can simply make it a Vec<&str> and borrow the author names from Entry.author fields instead of cloning them!
We still need to clone the author name into an owned String when we merge the round-specific data set to the top-level HashMap because this data set outlives the round-specific data set. However, it is important to note here that we only need to create a String the first time we award a point to the author – after the first time, the author’s name is already present in the map (and owned by the map), so we do not need an owned copy of their name just to award more points.
Let’s apply these changes. First, we will borrow the author name from each entry in the round-specific processing logic, adjusting the Vec<String> to become a Vec<&str>. A highlight of the first batch of relevant changes is the following:
Then we adjust to follow “allocate owned string only on first point” logic near the end of the same function:
Some changes omitted from snippets. Full code: v02_less_cloning.rs
The benchmark results are promising:
memory/v01_simple       time:   [1.7808 s 1.7962 s 1.8128 s]
memory/v02_less_cloning time:   [1.4774 s 1.4829 s 1.4884 s]

Allocation statistics:

| Operation             | Mean bytes | Mean count |
|-----------------------|------------|------------|
| v01_simple            | 2154088990 |   10697388 |
| v02_less_cloning      | 2133374621 |    2916539 |
The allocation count went from 10 million to a little under 3 million. The number of bytes allocated did not change much but do not despair – the truth is that the allocated object count tends to be far more impactful than the number of bytes allocated, so this is already great progress, as also proven by the duration of a benchmark iteration decreasing by a substantial amount.
Once we run the profiler again (remember to cargo build --release --examples first), VTune indicates that the top contributor to memory allocation calls has now changed. Let’s continue by analyzing the new top result.
Optimization: borrow the JSON values
After eliminating the needless cloning, the stack trace that landed at the top starts with the following:
profile_target.exe!serde_json::de::impl7::deserialize_string<serde_json::read::StrRead,serde_core::de::impls::StringVisitor>+0xf6 - de.rs:1555

profile_target.exe!serde_json::de::impl7::deserialize_struct<serde_json::read::StrRead,poetry_contest::v02_less_cloning::_::impl0::deserialize::__Visitor>+0x33e - de.rs:1849

profile_target.exe!serde_core::de::SeqAccess::next_element+0x41 - mod.rs:1773

profile_target.exe!serde_core::de::impls::impl19::deserialize::impl0::visit_seq<poetry_contest::v02_less_cloning::Entry,serde_json::de::SeqAccess<serde_json::read::StrRead> >+0x70 - impls.rs:1165

profile_target.exe!serde_json::de::impl7::deserialize_seq<serde_json::read::StrRead,serde_core::de::impls::impl19::deserialize::VecVisitor<poetry_contest::v02_less_cloning::Entry> >+0xa8 - de.rs:1750

profile_target.exe!serde_json::de::impl7::deserialize_struct<serde_json::read::StrRead,poetry_contest::v02_less_cloning::_::impl0::deserialize::__Visitor>+0x217 - de.rs:1849

profile_target.exe!poetry_contest::v02_less_cloning::_::impl0::deserialize+0xc - v02_less_cloning.rs:168
There are many entries about serde_json in this stack trace and while the details of what each entry means are unclear, the names paint a general picture that suggests serde_json is allocating a lot of memory when deserializing strings.
To form a better picture of what is being allocated and why, let’s review how the JSON document is loaded in our simple implementation:
- We load the entire JSON file into memory as a
String. - We convert this to an object model via
serde_json. - The object model has fields mostly of type
String.
Example of a type in the object model:
By defining our fields with the String type, we require serde_json to copy the contents because each String is always a new memory allocation in Rust. Therefore it makes complete sense that we see many string allocations as we simply force serde_json to allocate all these strings for us!
Under specific circumstances, it is possible to avoid these String allocations when parsing JSON documents with serde_json, by instead making it borrow values from the input data set it is deserializing the object model from. This requires the following preconditions to be met:
- The JSON document is fully loaded into memory as UTF-8 text.
- The JSON document is stored in a
Stringor an equivalent slice of bytes. - The logic that processes the deserialized types can borrow this
String. - The logic that processes the deserialized types can tolerate generic lifetime parameters and still remain maintainable.
- The contents of the field can be loaded from JSON without transformation (i.e. string values do not contain any escape sequences that need to be unescaped).
- The object model is simple enough for
serde_jsondeserializer-generation logic to figure out how to create an efficient deserializer for it.
These conditions cannot always be satisfied, so this optimization is not always applicable. For example, because:
- Sometimes the JSON document may be only partially loaded at a time (e.g. in a streaming fashion).
- Sometimes the JSON document may not be UTF-8 but instead be in UTF-16 or some other text encoding.
- Sometimes the document is not in a
Stringbut in a sequence of multiple separate byte buffers (which is not supported byserde_json). - Sometimes borrowing the original
Stringis not feasible due to API layering in the logic that needs to consume the data model. - Sometimes the extra lifetime parameters required turn the business logic code into an unreadable and unmaintainable mess.
- Sometimes string values in the JSON contain escape sequences and must be transformed before they can become Rust strings.
- Sometimes the object model is too complicated for the
serde_jsonmacro-transformations to understand how to generate a borrowing-capable deserializer for it.
In our case, we have partial compatibility with these requirements:
- ✅ Yes, the JSON document is fully loaded into memory as UTF-8 text before processing.
- ✅ Yes, the JSON document is stored in a
String. - ✅ The business logic probably supports borrowing this
String(at least no obstacles are apparent at this stage). - ✅ The business logic probably remains readable/maintainable after gaining more lifetime parameters, as it is relatively simple for demonstration purposes.
- In real-world applications this point can often be the downfall of this optimization as complex real-world business logic can be much less tolerant of lifetime parameters.
- 🤔 The contents of some fields can be loaded from JSON without transformation… most of the time. We cannot guarantee this – it is always possible that some special characters are present in the JSON fields in escaped form, requiring unescaping before they can become part of a Rust string. For the
Entry.contentsfield we pretty much guarantee that we cannot meet this requirement, as all the newline characters in this field will require unescaping. It is a poetry contest, after all, and poetry tends to have multiple lines. - 🤔 Some types in the object model are simple enough for
serde_jsonto deserialize efficiently. Other types are not simple enough and will causeserde_jsonto generate a suboptimal deserializer (more on what this means below).
This suggests that some gains are indeed possible by borrowing the JSON contents instead of allocating new Strings for every field. However, some risks are present – we need to be thorough to ensure we are aligned with serde_json requirements to obtain maximally efficient behavior.
We can start by blindly making every field in our data model borrow-compatible. The good news is that if we allow it then serde_json can automatically try to use borrowing if the preconditions are met, and automatically fall back to copying when the preconditions are not met, without relying on us to identify which is the case with each field or each value.
For this fully-automatic opportunistic borrowing, we must apply the following transformations to the object model:
- Data types gain a
'jsonlifetime, their form now beingstruct Entry<'json>. - Fields that need to borrow data are decorated with the
#[serde(borrow)]attribute - String-typed fields become
Cow<'json, str>.- Note that
PathBuf(inManifest.rounds) is just a special type ofStringand becomesCow<'json, Path>.
- Note that
- Nested structures forward the lifetime to their parent and also gain the
#[serde(borrow)]attribute.
In addition to modifying the data model, we also need to modify the logic functions to carry the necessary lifetimes on the data, as well as to use Cow instead of String whenever the lifetime parameters allow us to do that. Highlights of relevant changes are as follows:
Some changes omitted from snippets. Full code: v03_borrow_document.rs
Let’s benchmark this version of the code to see what impact our changes had.
memory/v01_simple       time:   [1.7808 s 1.7962 s 1.8128 s]
memory/v02_less_cloning time:   [1.4774 s 1.4829 s 1.4884 s]
memory/v03_borrow_document
                        time:   [1.4230 s 1.4264 s 1.4299 s]

Allocation statistics:

| Operation             | Mean bytes | Mean count |
|-----------------------|------------|------------|
| v01_simple            | 2154088990 |   10697388 |
| v02_less_cloning      | 2133374621 |    2916539 |
| v03_borrow_document   | 2027336748 |    1683593 |
That is good progress! We have cut the allocation count by a good margin and removed another 60 milliseconds from the total runtime.
However, recall that we had a big list of requirements for efficient borrowing of the JSON data. We saw an improvement in the benchmark numbers so something is clearly happening but if we want to be thorough, we need to understand the specific impact of our changes. Remember that we are using the full-auto “borrow when you can, otherwise allocate” mode of operation in serde_json. What fields are really being borrowed? And are there some fields where serde_json is falling back to creating owned copies of data?
The simplest way to test this is literally to test this – we can create a unit test that will verify that strings in our data model are borrowed (or not):
Test entry point: validate_cow_borrowing() in v03_borrow_document.rs
As you may observe from the inline comments in the above logic, the situation is not great:
| Field | Deserialization mode |
Manifest.categories.keywords[i] | Owned (allocates memory) |
Manifest.rounds[i] | Owned (allocates memory) |
Entry.author | Borrowed |
Entry.title | Borrowed |
Entry.contents | Owned (allocates memory) |
Only two fields are actually borrowing their data – for the rest of the fields, our changes merely made the code more complex (and potentially slower!) without actually benefitting us.
Not good enough! Let’s examine the problematic fields in detail to understand which serde_json requirements are not met:
Manifest.categories.keywords[x]– this fails the “simple data model” requirement becauseserde_jsondoes not understand how to efficiently borrow values when dealing with aVec<Cow>.Manifest.rounds[x]– same problem,serde_jsondoes not understand how to efficiently work withVec<Cow>.Entry.contents– this fails the “no transformations” requirement. The contents contain newline characters, which are escaped in JSON form and must be unescaped before loading into Rust strings.
Good news! We can work around the poor efficiency of serde_json when working with Vec<Cow> by applying some extension logic to the data model. The issue with Entry.contents seems to be a bigger headache and we will come back to that one in a later chapter.
The serde_with package has what we need to efficiently handle Vec<Cow>. It contains the BorrowCow pseudo-type that encourages serde_json to do the right thing when working with a Vec<Cow> field. To improve the efficiency of the generated deserializer, we need to add the #[serde_as] attribute to both the type and the field and imprint the BorrowCow pseudo-type onto the deserialization logic of the field:
What does this really do? Leave a comment if you know! For the purposes of this article, all that really matters here is that it makes the borrowing work. That’s all there is to it! Now, serde_json suddenly does the right thing even for Vec<Cow> fields.
Some changes omitted from snippets. Full code: v04_borrow_more.rs
Problem solved?
memory/v01_simple       time:   [1.7808 s 1.7962 s 1.8128 s]
memory/v02_less_cloning time:   [1.4774 s 1.4829 s 1.4884 s]
memory/v03_borrow_document
                        time:   [1.4230 s 1.4264 s 1.4299 s]
memory/v04_borrow_more  time:   [1.3603 s 1.3648 s 1.3695 s]

Allocation statistics:

| Operation             | Mean bytes | Mean count |
|-----------------------|------------|------------|
| v01_simple            | 2154088990 |   10697388 |
| v02_less_cloning      | 2133374621 |    2916539 |
| v03_borrow_document   | 2027336748 |    1683593 |
| v04_borrow_more       | 2027264175 |    1669789 |
Problem solved! That’s another 60 milliseconds saved per iteration.
We will come back to the Entry.contents field later. Meanwhile, let’s look at what else bubbles to the top of our profiler stack traces, ignoring any remaining serde_json stack traces under the assumption that they are related to Entry.contents.
Optimization: reserve capacity in advance and reuse temporary collections in loops
As we skip past the serde_json related entries, one of the remaining stack traces contains the following details:
profile_target.exe!alloc::raw_vec::RawVec::grow_one<usize,alloc::alloc::Global>+0xd - mod.rs:340

profile_target.exe!alloc::vec::Vec::push_mut+0x22 - mod.rs:2605

profile_target.exe!alloc::vec::Vec::push - mod.rs:2522

profile_target.exe!poetry_contest::v04_borrow_more::solve_round+0x372 - v04_borrow_more.rs:105
We are pushing something to a Vec and the Vec needs to grow its capacity to accommodate more data. This is very much expected – we do indeed have a bunch of Vec and we do indeed push more values to them over time, requiring them to grow. The same logic likely also applies to HashMap and other types of collections we may create in our program.
Let’s examine what collections we are actually creating in our logic, so we can analyze each individually:
- For each contest entry, we determine a
matched_categoriescollection to identify what categories the entry qualifies for. - In each round, we create a
best_by_categorycollection to identify the winning authors in each category, who are themselves referenced by a nested collection of authors keyed by the category – it is a collection of collections. - For the entire program, we create a
keyword_to_categoriesmap to identify which keywords qualify entries for which categories. Again, this is a collection of collections. - Finally, we have a
points_by_authormap that tallies up the accumulated score.
There are two important optimizations we can apply to each of these collections (including the nested collections):
- If we know the required size in advance, we can create the collection using
::with_capacity(), which reduces the number of memory allocations needed when filling the collection by avoiding incremental growth. This requires us to know the required capacity in advance, though, so is not universally applicable. - If a series of temporary collections is used in a non-overlapping manner (e.g. in each iteration of a loop), we can keep a single collection around and reuse it instead of creating a new one each time.
- This not only avoids repeated memory allocation but can also help ensure the collection has a reasonable capacity even if we do not know the required capacity in advance. It makes sense to assume that iteration 35 will need a collection of approximately similar capacity to iteration 34, so by reusing the collection we by default get one of suitable capacity, assuming an evenly spread workload.
Let’s look at each collection individually and determine whether we can optimize anything on these aspects.
For matched_categories we know the upper bound – an entry could at most match every category, so the upper bound is the count of categories, though we do not know how many each entry will match so we risk over-sizing the collection if we just go with the number of categories. This collection is not needed after an entry has been processed, so it can be reused between entries, which also allows it to dynamically grow to a natural size large enough to fit the peak count without risking oversizing. ✅ Optimization is possible (via reuse).
For best_by_category we know the exact size of the outer collection (the number of categories). The number of items in each inner collection is unknown – it may be as low as zero (no entries matched a category) or some arbitrary number (multiple entries tied for the category) but will typically be low, so a specific reservation seems unlikely to be beneficial but we know it will be at least 1 (we will not add entries with empty inner collections). What complicates matters, however, is that we have a 'round lifetime in this collection as it borrows the author names, which are round-scoped data. This makes it impossible to reuse this collection across rounds (at least with safe Rust code). ✅ Optimization is possible (via ::with_capacity()).
The keyword_to_categories map and its inner collections are reused for the entire program and has a fixed size – we can just reserve it once. Given that it is only generated once and then merely read, the potential gains are minimal but we might as well do it to be thorough. ✅ Optimization is possible (via ::with_capacity()).
The points_by_author map does not have a size that can be known in advance, as authors are not known in advance – we only learn about authors as we iterate through the rounds. ❌ There is likely nothing we can do to optimize the memory allocation behavior of this collection.
Let’s apply these changes and run the benchmark again.
Updated code: v05_reserve_and_reuse.rs
memory/v01_simple       time:   [1.7808 s 1.7962 s 1.8128 s]
memory/v02_less_cloning time:   [1.4774 s 1.4829 s 1.4884 s]
memory/v03_borrow_document
                        time:   [1.4230 s 1.4264 s 1.4299 s]
memory/v04_borrow_more  time:   [1.3603 s 1.3648 s 1.3695 s]
memory/v05_reserve_and_reuse
                        time:   [1.3572 s 1.3615 s 1.3657 s]

Allocation statistics:

| Operation             | Mean bytes | Mean count |
|-----------------------|------------|------------|
| v01_simple            | 2154088990 |   10697388 |
| v02_less_cloning      | 2133374621 |    2916539 |
| v03_borrow_document   | 2027336748 |    1683593 |
| v04_borrow_more       | 2027264175 |    1669789 |
| v05_reserve_and_reuse | 1846838307 |     635174 |
A nice decrease in memory allocations, though not so big of an impact on wall clock time. Still, an improvement no matter how we slice it.
Having recharged our spirit with the easy win in this chapter, let’s return to that pesky Entry.contents field that refused to be borrowed earlier.
Optimization: entry contents as raw JSON
Many of the remaining memory allocations are for the contents field of the poetry contest entries, which cannot be borrowed because the value requires transformation (JSON-unescaping) before it can be turned into a String. Let us ponder what to do about this.
What is this field even for? We need to process the value of this field to calculate the weight of the entry for scoring purposes and to disqualify entries that do not meet content requirements. This requires the unescaped final string to accurately execute our business logic. There is no way around the need for this transformation.
There is an underlying assumption here that may be blinding our eyes to the obvious, however – we do not necessarily need to perform the unescaping at deserialization time! We only need to access the unescaped form of the field temporarily, when processing each entry.
Therefore, we could borrow the raw value of the JSON when deserializing and later only unescape the string when we need to process it. This later transformation can be performed with reused memory buffers, without a new allocation for each entry!
To implement this, we first need to change the field type to &'json RawValue, which gives us the raw form of the JSON value while guaranteeing that it is borrowed.
Then we simply implement the algorithms we need on the raw JSON string instead of the processed string, unescaping inline using reusable memory buffers where needed.
Some changes omitted from snippets. Full code: v06_raw_contents.rs
Note that the field is processed using a thread-local reused buffer. While the current program is single-threaded and could just as well use a global static buffer, real-world apps tend to be multithreaded, so using thread-local buffers is a more realistic implementation. Additional considerations apply for asynchronous logic but that is outside the scope of this article.
Benchmark results indicate movement in a desirable direction, with a good jump down in memory allocation numbers and a decrease in total duration:
memory/v01_simple       time:   [1.7808 s 1.7962 s 1.8128 s]
memory/v02_less_cloning time:   [1.4774 s 1.4829 s 1.4884 s]
memory/v03_borrow_document
                        time:   [1.4230 s 1.4264 s 1.4299 s]
memory/v04_borrow_more  time:   [1.3603 s 1.3648 s 1.3695 s]
memory/v05_reserve_and_reuse
                        time:   [1.3572 s 1.3615 s 1.3657 s]
memory/v06_raw_contents time:   [1.3448 s 1.3496 s 1.3550 s]

Allocation statistics:

| Operation             | Mean bytes | Mean count |
|-----------------------|------------|------------|
| v01_simple            | 2154088990 |   10697388 |
| v02_less_cloning      | 2133374621 |    2916539 |
| v03_borrow_document   | 2027336748 |    1683593 |
| v04_borrow_more       | 2027264175 |    1669789 |
| v05_reserve_and_reuse | 1846838307 |     635174 |
| v06_raw_contents      | 1049334065 |      46218 |
Optimization: reuse JSON buffers for each round
Once again we turn to VTune to ask it what contributes to memory allocation activity.

You may be starting to notice that the lines we are looking for are getting lower and lower in the main list each time – a sign of good progress! This time it leads us to the following in the stack trace:
profile_target.exe!alloc::string::String::try_reserve_exact+0xd - string.rs:1341

profile_target.exe!std::fs::read_to_string+0x13 - fs.rs:355

profile_target.exe!poetry_contest::v06_raw_contents::solve_inner+0x510 - v06_raw_contents.rs:89
That is quite straightforward to understand: our program reads all the data of each contest round into memory before processing it. At the moment, we are reading each into a new string via fs::read_to_string(). We can instead reuse the same String and save some time by avoiding constant reallocation for each round.
Full code: v07_reuse_more.rs
A simple and straightforward change, while also surprisingly effective:
memory/v01_simple       time:   [1.7808 s 1.7962 s 1.8128 s]
memory/v02_less_cloning time:   [1.4774 s 1.4829 s 1.4884 s]
memory/v03_borrow_document
                        time:   [1.4230 s 1.4264 s 1.4299 s]
memory/v04_borrow_more  time:   [1.3603 s 1.3648 s 1.3695 s]
memory/v05_reserve_and_reuse
                        time:   [1.3572 s 1.3615 s 1.3657 s]
memory/v06_raw_contents time:   [1.3448 s 1.3496 s 1.3550 s]
memory/v07_reuse_more   time:   [1.1975 s 1.1992 s 1.2010 s]

Allocation statistics:

| Operation             | Mean bytes | Mean count |
|-----------------------|------------|------------|
| v01_simple            | 2154088990 |   10697388 |
| v02_less_cloning      | 2133374621 |    2916539 |
| v03_borrow_document   | 2027336748 |    1683593 |
| v04_borrow_more       | 2027264175 |    1669789 |
| v05_reserve_and_reuse | 1846838307 |     635174 |
| v06_raw_contents      | 1049334065 |      46218 |
| v07_reuse_more        |  121436219 |      45720 |
Blocked optimization: reuse more data structures between rounds
You might perceive an obvious follow-up to the previous optimization: if we can reuse the raw JSON file buffers, why not also reuse all the other various Vec and HashMap instances we allocate in every round? After all, their sizes are likely going to be very similar between rounds, so the reuse potential is good.
This possibility was briefly mentioned in a previous chapter already but is worth bringing up again here, as it is such an obvious opportunity.
The trouble is that the types of these collections are tainted with the 'round lifetime, which prevents us from keeping them for longer than a single round. Because of this, we must allocate them fresh for each round.
Reusing such data structures is still technically possible. For example, we could overwrite the lifetime of one round with the lifetime of another round. However, this would require unsafe code, which is outside the scope of this article.
We have reached “good enough”
The lines that concern memory allocation are now very low in the VTune output, indicating that the remaining allocations are a minor contributor to the processor time consumed by the program.
Let’s recap what we achieved:
| Iteration | Wall clock time (s) | Allocated bytes (MB) | Allocated objects (K) |
| Initial version | 1.7962 | 2054 | 10 697 |
| Reduced cloning | 1.4829 (-17%) | 2035 (-1%) | 2 917 (-73%) |
| Borrowing fields from JSON document | 1.4264 (-21%) | 1933 (-6%) | 1 684 (-84%) |
| Borrowing more fields | 1.3648 (-24%) | 1933 (-6%) | 1 670 (-84%) |
| Reserve and reuse collections | 1.3615 (-24%) | 1761 (-14%) | 635 (-94%) |
| Borrow the entry contents as raw JSON | 1.3496 (-24%) | 1001 (-51%) | 46 (-99.6%) |
| Reuse JSON buffers | 1.1992 (-33%) | 116 (-94%) | 46 (-99.6%) |
Observe that even though the initial profile suggested 20% of time was spent on memory allocation operations, we ended up with a 32% decrease in program duration. Memory efficiency often leads to gains across the board.
Reducing memory allocations is one of the simplest and most effective ways to speed up programs, as a huge part of a typical application is spent allocating memory. The techniques described in this article are generally applicable and valid for many different types of applications. While the example scenario focused greatly on JSON processing, the investigative techniques of applying alloc_tracker in combination with VTune for detailed feedback will yield good results also in other scenarios.
Bonus optimization: use faster maps
This is not a memory allocation optimization but it is such a common mistake to use the default HashMap that it deserves calling out nevertheless.
The default HashMap in Rust is designed to be resistant to attack when its keys are attacker-controlled (e.g. HTTP request headers). This comes at a cost of inefficiency. In many cases, it is perfectly fine to use a faster hashing mechanism for a substantial increase in HashMap efficiency. Among the best alternatives here is foldhash.
Simply replace a std::collections::HashMap with foldhash::HashMap and it will get faster. What we lose is some degree of resistance to certain resource consumption attacks when the keys come from user input, which in many cases we do not care about, either because the input does not come from the user or because the risk is acceptable in the relevant business context.
There are three HashMaps in our program where we can apply this optimization:
That use statement is all we need for the change to take effect – after replacing the import of std::collections::HashMap with this line, the existing code is now simply faster.
With this simple change we went from 1.1992 seconds down to 1.1320 seconds bringing the final tally to a -36% decrease from the starting point. Remember to use a faster HashMap when you do not need the extra promises made by the default one!
